FPGA meets DevOps - Metrics
In the previous blog post we learned how to integrate Xilinx Vivado with Docker and Jenkins to build automatically (or with a single button) the FPGA bitstream.
During the project life span, the FPGA bitstream is going to be built a large number of times. Wouldn’t be interesting to collect metrics from each build and track them?
In this blog post of the series “FPGA meets DevOps” I am going show you how to get metrics from a Xilinx Vivado build and track them in Jenkins using the Plot plugin.
In particular we are going to track resource usage (i.e. LUT, FF, DSP and memory). This gives you insight on how the resource usage evolved during the project life span and if the FPGA is getting too full.
Also if you notice an unexpected sudden variation (increase or decrease) of resource usage it might be a sign of a problem in the design. Since the source code is under version control and the build is automatic, it is very easy to find the differences between two builds. Select the build of interest and under changes you can see the various commits between the current build and the previous one.
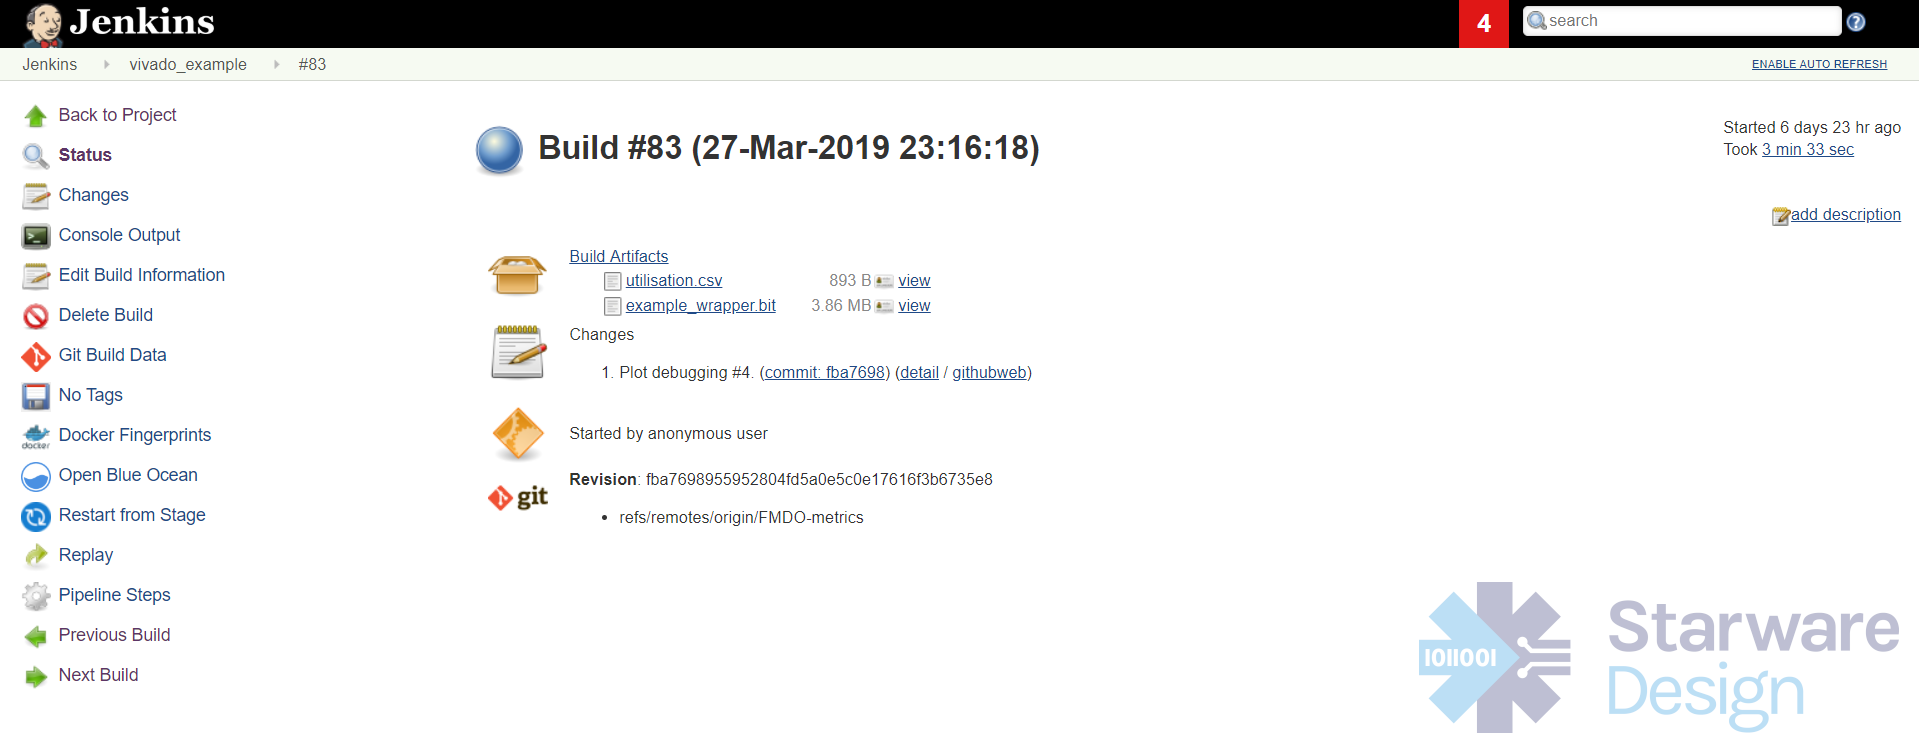
Select “detail” and then “diff” to see the details of the changes.
The simplest way to generate a resource usage report is to use a TCL script from the Xilinx TCL store. I highly recommend to have a look at the various scripts available since there are quite a few hidden gems that can be useful for your day-to-day work with Xilinx Vivado.
Here there is an introduction about the Xilinx TCL store https://www.xilinx.com/video/hardware/introduction-to-the-xilinx-tcl-store.html
The script report_failfast (part of the design utils) can be used to generate a CSV file with the resource usage and such file format can be parsed by the Jenkins Plot plugin (https://plugins.jenkins.io/plot) to plot a graph with metrics for each build.
I have used sed to do some post processing of the CSV file.
Note that the project implementation has to be opened before report_failfast can be called.
We can now add the metrics plotting as pipeline step inside the Jenkinsfile.
Selecting Plots on the left hand side, you can see the plot of the metrics Jenkins is collecting at each build.
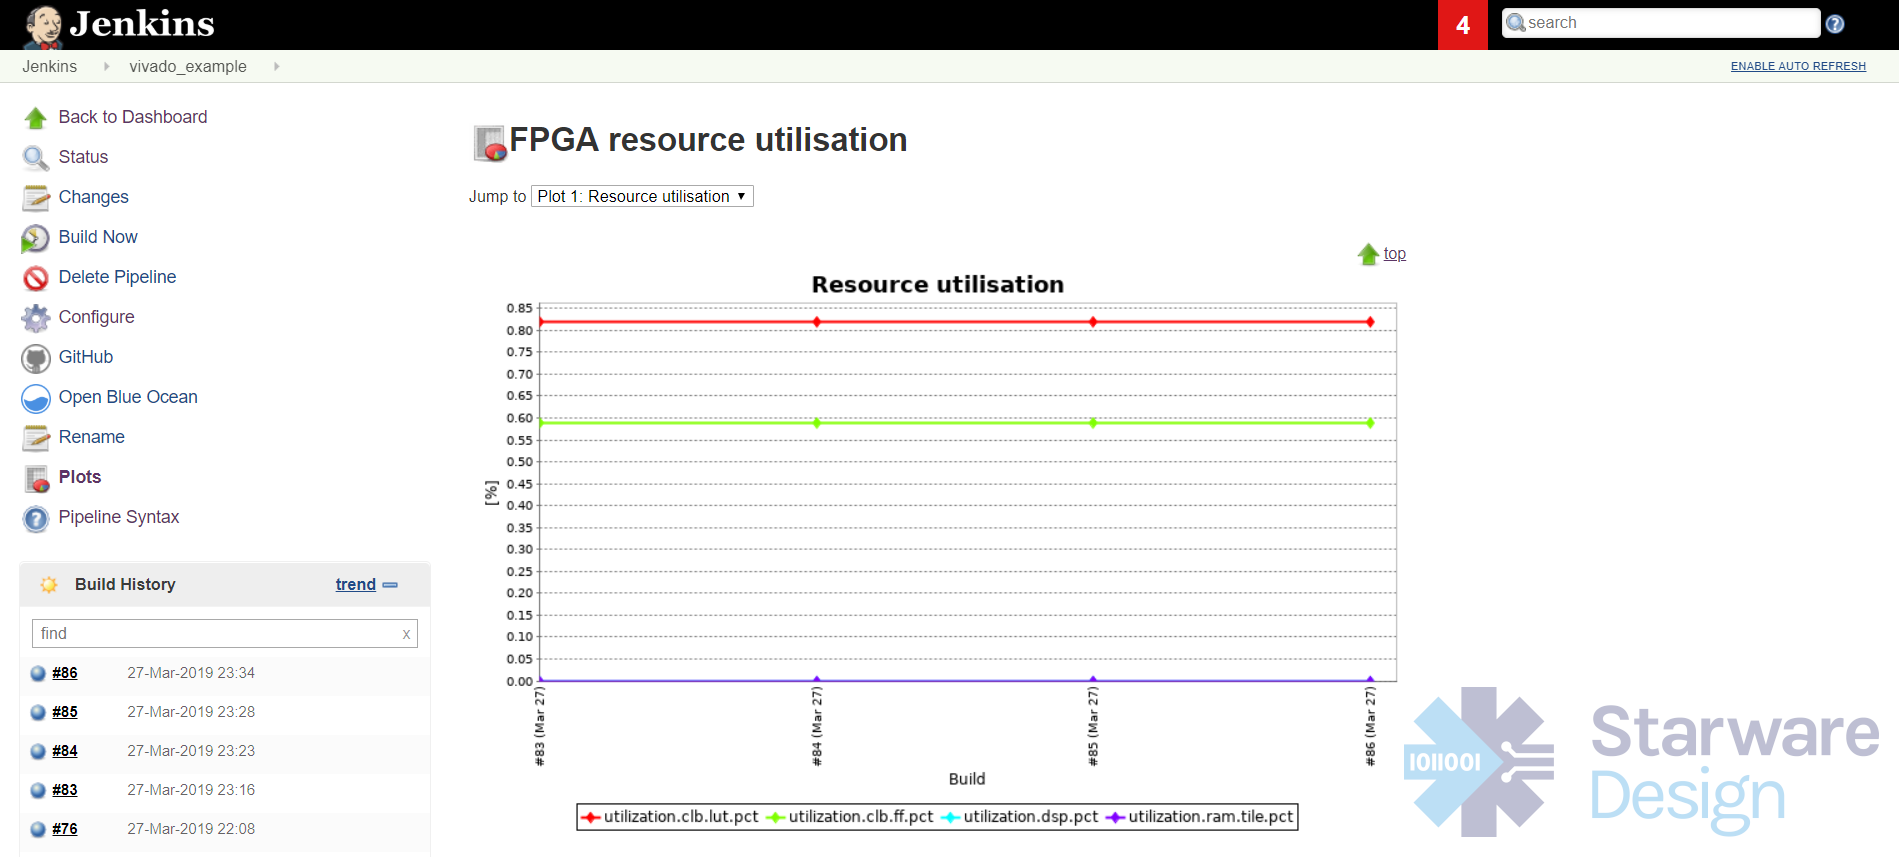
This is just an example of possible metrics. Other metrics could be i.e. the number of warning messages during the build, worst case slack from the timing report, number of warnings from the CDC report, etc.
In the next blog post we’re going to add the build version/number to FPGA bitstream.